

shellbadger
-
Posts
101 -
Joined
-
Last visited
Everything posted by shellbadger
-
There are recurring questions about trackable endurance and travel on the forum for which there are often very good responses, but based on limited information. The writer in a position to address most of the questions in more detail, and will do so in a series of posts over the next couple of years. I will explain. From January of 2010 to January 2023, I have released over 5,000 travel bugs at a rate of 200-450 per year. Over 13+ years some of the trackables have visited caches all over the world. They have been to every state in the US, every major administrative district (state, province, canton, oblast) in the countries of western and northern Europe, including the principalities of Andorra, San Marino, Lichtenstein and Monaco. My trackables have visited caches on every continent, including Antarctica. For now, the best supports of that claim are my past forum posts and the screen-captured map below, produced by gctrackables.com in open beta testing. What is shown is the distribution a sample of only a thousand of my trackables, sorted into either traveling trackables (blue markers) and missing trackables (green). For reasons unknown to me, not shown are the distribution of some trackables in caches. My trackables are not uniform in shape, size or composition. Some are simply the celebration tags marketed by Groundspeak (Makers, Holiday, CITO, Geopets, Zodiac, etc.), usually without attached items. However, most trackables do have items attached to dog tags (by chains or rivets) which can be glass, stone, wood, leather, metal, cloth patches or laminated images. Many are the size of poker chips (some are poker chips), others are smaller. There are keychain and jewelry pendants. The largest are laminated images measuring 2.25 x 3.25”. There are very few geocoins and no bowling pins or beanie babies. Should the reader wish to see photos of the trackables, they are all listed alphabetically by series name behind the “owned trackables” link on my profile page. I keep records on my trackables by series, based on either a theme or a general shape…see the first entries of the partial Comics spreadsheet below. After I enter drop dates, elapsed days between drops and the cumulative days between release and the most recent drop are calculated automatically. Shown in the first two columns are the number of drops achieved (Cnt for count) and the most recent drop log date (Last Log). These are also calculated automatically. A zero in the Cnt column means the trackable has either not moved, or has disappeared from, the container where it was released. I also maintain a catalog of my trackables…see partial catalog spreadsheet below. It displays part of the catalog with details about the Art Deco series. I hid many columns to make important information viewable as an image. There are two catalog numbers, the annual and total. Trackables are not cataloged until they are released. All entries start with the name, ID and tracking numbers and release dates and locations. The colored ID cells indicate missing travel bugs. For those, there is information on the last logged locations and dates, along with the count (Cnt) of drops achieved (retrieved from the respective series spreadsheet). The ultimate objective of this approach, decided upon years ago, was to enable comparisons of the rates of travel and survivorship among the series. For example, as a group, do poker chips have better histories than laminated images? For a series to be included for comparison in this project, I determined that each series must have at least one trackable achieve 30 drops, but there is a problem with that choice. Being 83 at this writing, there might not be enough time for me to do as much as once conceived. So, I will content myself with limited comparisons. Part 2 of this post defines release and drop, as employed in this project.


-
Trackables Move More Frequently in Europe Than in US
shellbadger replied to shellbadger's topic in Trackables
I absolutely believe there are there are significant regional and cultural differences toward logging and handling trackables here in the US, as well as internationally. I have the sense that best cachers everywhere are the same, but there may be more uncommitted or indifferent cachers is some places than others. The problem is I can't figure out how to tease away other factors that might cloud the issue. On a quick glance at data, I might conclude that Wisconsin and other states of the Upper Midwest are the best places for my trackables, in terms of frequency of movement and longevity. However, I note that these trackables are consistently moved by the same few cachers. What does that mean? On the other hand I might conclude that Texas is the absolute worst place for trackables, since about 60% of them go missing here. Half of my trackables are gone before five drops. The problem is, Texas is large enough that it can take more than five drops to escape the state. Is it fair to make comparisons to contiguous states, or states out of reach of five drops? Texas has some large urban areas, but most of the state is rural, like most of the western states. Perhaps not to the same extent as Australia, but we have have some large regions without caches or cachers...I personally have roadside caches that average only 2-3 visits per year, and the best ones are 35. By contrast, look at a cache density on the caching map of Germany or the the Netherlands. Furthermore I have trackables in caches on mountains of Colorado and Utah that have not been visited for years, there is nary a one in the European alps. Then again, we are playing a game with neither rules nor consequences for bad behavior...what should we expect? -
I used to ask for photos in my trackable mission statement, and the geocaching public responded. Some of the images were really interesting, and like you, I wanted to share them. So, I started a blog (here). As an incentive, I went so far as to include the link to the blog in the mission statement, to illustrate how photos would be displayed. Eventually though, as I released more trackables, the images started arriving faster and faster. Sorting, editing and uploading became drudgery...it was the tail wagging the dog, so I quit.
-
This post discusses the history of 23 5- to 10-year-old trackables that have made only 40-44 drops. This is the same collection discussed in the previous post, but examined in a different manner. Here, data were supplemented and tabulated to show the travels of each trackable. The table includes the release locations and dates, and last locations and dates (as of Dec 2021). Also provided is the ID number, the age of each trackable at last the last logged date and a brief summary of the countries traveled. The country names are abbreviated to the universal three-letter designations as shown in the smaller table below. In the release and last location columns, more specific regions within a country are also provided. Of the 23 trackables achieving 40-44 drops, 14 (<1%) releases were of more than 2100 to mostly roadside containers in my core caching area in northwest Texas. There were nine releases in Europe. Those in France are two (50%) of four I dropped in caches on the Normandy beaches. Those in Belgium are seven (23%) of 30 released at a Mega in Bruges, by a Belgian fan of Buddy Holly. That person’s releases of my trackables were in exchange for Buddy memorabilia sent from Buddy’s hometown. Far, far fewer US releases have reached as many as 40 drops. Similarly, if we examine the last locations of these same 23 trackables, we see that two (nos. 1, 16) were in the US while the remainder were in Europe. Neither of the two last located in the US, had their travel history wholly in the US (consult the rightmost column of the table). Some readers might object that the trackable (no. 1) having been across the border in Canada is no different than being in the US. However, I have the unsubstantiated opinion that Canadian stewardship of trackables is more like that observed in Europe, than in the US. Wherever the reader stands on this point, unlike in Europe, it remains exceedingly rare for a trackable never leaving the US, to be moved by as many as 40 different cachers. I would remind the reader that I have other trackables having made out to 75 drops, and more, and all of them are in Europe. One final point can be made. The arrangement of countries in in the Chief Travel column is not in the sequence of visitation. The first country listed is that of release. Next listed is the one most commonly visited by that trackable and all the other trackables, and so on. All but one of these trackables has been dropped in Germany (DEU) at one point, followed by the Netherlands (NLD) and Belgium (BEL). This is why I and others have remarked that if a trackable survives long enough, no matter the origin, the trackable will pass through northern Europe, and more specifically, Germany.


-
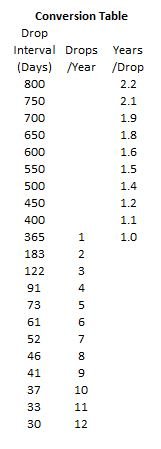
For each of my trackables, I record the date of release and the dates of all subsequent drops (or changes of possession). The total number drops divided into the total days between the dates of release and last drop is the average movement interval for that trackable. Low interval numbers mean frequent movement, higher numbers are slower movement. To understand these numbers on drops a per-year basis, see the Conversion Table below. My trackables are not uniform. Some are just a tag alone in circulation, whereas most are the usual dog tag attached to items of varying sizes, shapes and materials. This post is the first step in comparing endurance and rates of travel among trackables that can be confidently sorted into discrete groups, poker chips, flag patches, laminated images, etc. In the meantime, I will report on the observed drop intervals in some of my oldest trackables as a whole. The present sample includes only trackables released in the years 2010-2015. Old trackables have the advantage of yielding values that will not change, because all but a handful have been missing for 5-10 years. Those few trackables that are still active, including some released in 2010, all have total drop numbers above 50, out to 75. This project does not extend that far, with drops numbers only to the range of 40-44. Furthermore, for higher drop totals, once they get beyond 50, an excessive interval will have only a barely discernable effect on the average. I keep up with my trackables by theme or series. The Sample Organization Table below shows the names of the series and part of the organization for this project. The values between the green columns are those intervals from trackables having made only 1-4 drops. The values between green and gold columns are intervals for trackables having made 40-44 drops. Not shown are seven other intermediate data sets in 5-drop increments. The abbreviations in the table are as follows: n, sample size; %, the percent of the series n; Ave, the arithmetic average interval; Min, the minimum interval observed; Max, the maximum value observed. A description of the trackables in in each series will be done in a later post, although the titles make many of the forms evident. The gray line in the graph has nothing to do with the drop intervals but, but is the sample sizes within each interval range…in a happy circumstance, the same scale as for intervals could be used. That line is essentially the same survivorship curve posted before, but with data pooled into discrete drop ranges. By almost any standard, a sample size of 885 for the 1-4 range is more than adequate. However, because of the high rate of attrition, the sample sizes drastically decrease through the other drop ranges, finishing with a 23 total for the 40-44 range. I elected not to graph the actual maximum and minimum values shown on the table. Instead, I used the mean of all the maximum (red line and red numbers) and minimum (blue line and blue numbers) values for each series. To have graphed the 1819 maximum for the Country Flags would have increased the distortion of the scale and merged the colored lines at the bottom, an important part of the graph. The averages (black line) are those for all the intervals in each interval range, not the averages of the averages, as for minimums and maximums. I showed in previous posts that around 95 percent of my 4500+ trackables are released in the US, mostly in northwest Texas. Furthermore, among all my trackables that survive to make 15 drops (around 13%), only half are in the US, most of the others are in Europe. Of those in Europe, only a little more than 200 were released there, another 700+ were independently taken there by other cachers. Thus, we may interpret that the part of the colored curves to the left of the 15-19 interval range result mostly from trackables in the US, and the curve to right is mostly from trackables outside the US, mostly Europe. The important point to be made is that at the left side (US) of the table and graph, the average drop interval is 132 days, or a rate of just over three drops per year. At the right, the average interval is 65 days, or almost six drops per year. Clearly it is the high extreme intervals (years, in many instances) on the US side and the lack of extremes on the right that most influence the average values. These data are part of the reason I am willing to state that trackable in Europe move almost twice as often (on average) as those here in the US. That more trackables last longer in Europe, will be addressed, in part, in the next post.


-
Predicting Trackable Longevity--A Primitive Actuarial Table
shellbadger replied to shellbadger's topic in Trackables
I am an infrequent visitor to the forum so I missed the posts above. One of the products of keeping detailed records over a long period of time is that it is a constant source of entertainment…at least it is for me. At the heart of my record-keeping was to identify longevity strategies. Multiple iterations of the mission statements had no discernible effect…in fairness I must admit that one of six trackables meant for grandchildren in Houston actually made the trip from Lubbock, by way of Hong Kong. Based on the accumulated information, I quit dropping bugs in urban caches, choosing instead to use my own rural caches for trackable dispersal. Then, I converted all my caches to Premium Member Only. Next, I quit using the chain-to-tag connection. I had tried super glue and crimping the link to no difference. Except for a handful, since 2015 I have been using rivets to connect tags to other items (see below). In truth, the improvement in longevity is only small percentages, but I am a tool/gear junkie and this was an excuse to buy a Milwaukee power pop-riveter. In another post I showed why my criterion for missing was a trackable without retrieval, visit or a drop log for three years…discovery logs are increasingly bogus and are not worth tracking. About 95 percent of trackable that do make drops do so within one year. After that the chances of reappearance become vanishingly small…but as shown in an earlier post above, it can happen. These values were derived solely from my trackables, but I cannot believe there would orders-of-magnitude differences in all trackables released. A common way that cachers remove lost or collected trackables from their inventories is to do a fake drop. I believe this practice is more prevalent in the US than in Europe…at least in the US there are far more of the multiple-years-between-drops intervals that are immediately followed by gone-missings. Only someone who keep records would notice this trend. Another annoying, but common, US strategy is to not log a retrieval until the drop, thus, in the meantime, a cacher ducks any responsibility for holding a trackable. I originally set up my spreadsheet to look at trackable size, shape and host material, I just haven’t done it yet. Instead, I first noticed the disparity in longevity and frequency of movement between trackables in the US vs those in Europe. To convince the doubters, I have been strengthening that observation with data ever since. Finally, I have no problem with sharing a basic spreadsheet. After ten years, my active spreadsheets have grown so much in size and function as to be no value to anyone else...they are all linked to or from other files. After creating an account, my initial foray into GitHub revealed a bunch of terms and acronyms about which I am utterly clueless. I think I need to find some other way to make my spreadsheets available.


.jpg.9ea9ef3890c19e90850fcbfb34a9414f.jpg)

-
It was about six years when I started getting serious about the illogical distribution of my trackables. At the time I was more focused on documenting longevity. Then, I noticed that Australia and New Zealand, on the other side of the world, had more of my trackables than any of the states bordering Texas (still true). That improbable inequity caused me to check my search functions and formulae, which were correct. Prior to that time, I had assumed trackables would move stepwise from my center, like the waves from a stone thrown in water. Naturally, I also assumed the concentration of trackable would diminish with distance, in a clinal fashion. Not true! I won't live long enough to understand a great deal about movement, there are just too many variables. I am curious, where do your Darwin-released trackable go? Is there any predictable pattern? I have had very few trackables even visit SE Asia or the Pacific islands (only Guam and Okinawa). I don't find language to be that much of a barrier, if one has patience and humility. Many Europeans can read, and also write in understandable English within the narrow context of a caching vocabulary. For those who can't, there is Google Translate...I use it almost every day. Just last week, I had a question about a TB photo taken in Denmark. I fashioned a message in English, using simple declarative and interrogative sentences, and translated it to Danish. The reply, in English, was to contact him in German, as he was a tourist. I sent English and German to him and he sent German and English to me. I had apologized for not being able to write German, despite my heritage. Then, over a couple of days, we conversed about the history of the region of origin of my German-speaking paternal ancestors in Lithuania (then Prussia). It may be a while before I generate another report. I am working up a catalog of missing trackables only, complete with locations and histories.
-
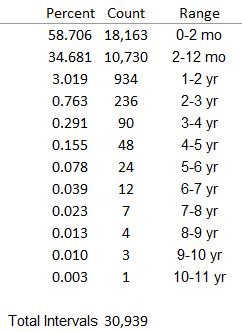
This post is a continuation of the one of 26-Oct-21. In it I presented graphs of the last log locations (last-logs) of my trackables in the United States (US) versus locations outside the US, which are mostly Canada and the countries of Europe. The present text is a discussion of the tabulated data from which those graphs were derived. The methods for acquiring the information used here are described in the previous post, but let me state again that about 75% of the trackables under discussion have had no logs for at least three years (my criterion for missing) while about 25% are considered still active. The layout of both tables below is exactly the same, so one description will suffice. The Location column is either countries or US states, depending on the table. The Release (Rel) column is total trackables released in the respective locations. The columns under Drop Intervals are counts of trackables having last logs that fall into the specified count category. The values in the 5 column are the pool for drops five through nine, and for the 10 column, it is for drop ten through fourteen, and so on. Both tables have 51 locations with at least one last-log. In the case of the US, it is all 50 states plus the District of Columbia (Washington DC). Even Little Rhody has five. The states with the greatest numbers are California (101), Colorado (57), Florida (62) and Texas (146). These all have caches in leisure destinations, many of which, in my opinion, are frequently black holes for trackables, particularly if they are urban and not Premium Member Only. That said, some Premium Members are well short of sainthood. Thus, trackable longevity is more about luck and probability, rather than some cacher designation. I would have expected Texas to have many more last-logs, given that more than 4,200 trackables have been released there. Moreover, my definition of an old trackable is one having more than 25 drops (about five years old, on average). Texas has none, ranking it below the 20 states do have old trackables. Granted, I want my trackables to move, and even leave the state, but something about this disparity is not quite logical. All trackables will eventually go missing, no matter where they are. Nonetheless, I have believed for years that trackables in Europe move more frequently and last longer than here in the US. This, and future posts should begin to convince others. In my previous report, I suggested the longevity two trackables at Drop 55 was aided by drops (not visits only) in Europe. I thought later to look at all entries at 25 drops and beyond. There are 37 total, with none past 60 drops. The seven orange cells are those with earlier drops in Europe. The four blue cells are those with drops in Canada. As is shown in the second table below, the Canadian profile fits best with those of European countries. Thus, I believe drops outside the US benefitted the longevity of 30 percent the old trackables in the US. The 37 old trackables are 0.85 percent of the 4354 trackables in the US and 0.81 percent of all 4593 trackables. It is said that if a trackable was to survive long enough, it would eventually land in Germany. The second table below supports that statement. Without any releases in that country, it is the location of more last-logs (142) than any place outside the US, and more than any US state except Texas, where most of the trackables are released. The distant second place is a tie between Canada and the UK at 112. Both countries should have some advantage over Germany…a long, shared US/Canada border and my semi-annual trackable trades with an Englishman that resulted in 158 releases, mostly in the UK. Some of the lesser counts are in locations that spur this vicarious traveler to continue making and releasing trackables. Included are the British Virgin Islands, the Isle of Man, Liechtenstein, the Seychelles, Turks & Caicos and the Ukraine. A recent visit to Antarctica by one of my trackables just missed being formally included in this report. When this particular project started, there had been 239 trackable released in Canada (2) and Europe (237), yet 712 last logs were counted in the non-US collection, leaving 473 trackables taken there from the US. Most of this movement must have been done before the C19 travel restrictions of the last two years, suggesting there could have been a larger total migration, under different circumstances. In the non-US sample, there are 167 old trackables of 25 drops or more. This is 23 percent of the 712 trackables outside the US and 4 percent of all 4593 trackables. These percentages are embarrassingly high when compared to the US-only percentages of 0.83 and 0.81, respectively. These data are why I regularly send trackables to a friend abroad, a few of my own and most of those discovered in my caches.


-
I did a handful of those some years ago (using the copy tags), and annoyingly, two of the originals showed up again, confounding my record-keeping...never again! If I am ever tempted to do it again I will just look at the attached table. It was originally put out several years ago, but this one is current. It shows that the vast majority (93+ %) of my trackables are dropped within a year of retrieval, but there are enough of those "others" that I don't want to risk it. This table is one of the ways I use the elapsed time between drops on my spreadsheets. I recently had one of my bugs show up after a 10-year absence. This table is also the basis for my using three years of inactivity to consider a trackable missing. Anything inactive for more than three years has a much less than 1% chance of reappearing. If it does, I just deal with it.
-
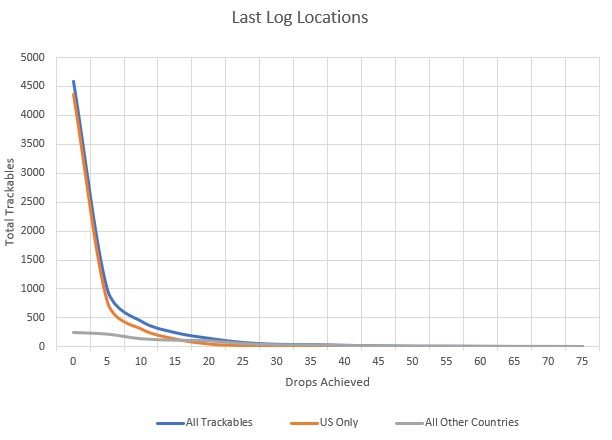
In my post of 17-Oct-21, I presented a survivorship curve based on the number of drops achieved by my entire collection of trackables, active and missing. Using the same data set, I sorted the trackables based on their last log locations (last-logs) in the United States (US) versus locations outside the US, which are mostly in Canada and Europe. In the first graph below, the blue line is exactly the same survivorship curve, but with two minor format changes. In the previous graph, the vertical scale was expressed as a percentage of the total, whereas this scale is total trackables. Secondly, the horizonal scale is compressed because of the manner I tabulated the data. The zero drop is the number of trackable released, but all the other drops represent pooled data to maintain my sorting spreadsheet at a manageable size. The value for five drops is actually the pool for drops five through nine, and for ten drops, it is ten through fourteen, and so on. The rationale will be clear in a later post, when I display the tables. To obtain the last-logs required visiting the home page of more than a thousand trackables having five or more drops. I started this particular effort on 22 Sep and finished on 20 Oct. Thus, although I would have wanted otherwise, it is likely some trackables are no longer at the locations initially recorded, and some trackables moved before the survey was complete. The last-logs were tabulated for each US state, and for each country…island protectorates were treated as distinct, to illustrate the geographic reach of trackables (details not shown here). For reasons that escape me now, I did not separate my trackables in Canada to her large provinces and territories. In the first graph, the orange line represents trackables having their last logs in the US. Clearly, it is the chief influence on the shape of the survivorship curve for all trackables (the blue line). It is characterized by the precipitous losses in the first third of the curve, made more dramatic by the data pooling mentioned above. The difference between the lines is the comparatively small number of trackables with last logs outside the US (the gray line). Removing the zero and five drops from the graph reduces the scale and permits a detailed look at the bottom of the curve…it reveals some interesting circumstances (see the second graph and appended table below). The first is there is a point between 15 and 20 drops (3.5 to 4.0 years, on average) where the orange and gray lines cross, which means that most of my trackables of that age are not in the US. It also means that the shape of the survivorship curve after 15-20 drops is dictated by trackable outside the US...the attenuation noted in an earlier post. Next, the contiguous gray line extends to 78 drops (more than nine years, on average), while the contiguous orange line stops at about 40 drops (six years, on average). There are two US, last-logs at 55 drops that do not show in the graph. While both trackables were released in the US (TB2T1NF, TB48HKK) , their longevity was augmented by time spent in Europe, where trackables receive much wider respect. Obviously, it is rare for a trackable that has never left the US to survive as many as 30 drops, especially given that half will disappear before five drops. A curiosity of the gray line is the step-wise shape, somewhat like waves on a beach. Perhaps it is a manifestation of a seasonal influx of trackables to Europe, something that has fallen off with Covid travel restrictions. A word of caution going forward. The reader should not interpret the gray line as a survivorship curve for trackables outside the US. I will show in a later post that there are more than twice as many of my trackables outside the US as have been released there. This means trackables leaving the US, to some as yet unmeasured extent, overwhelm and conceal the actual, non-US attrition. To get at the true rate-of-loss for both populations, one must identify and test inactive (missing) trackables that never left the US against those trackables that have never been to the US. That is a future project that must wait until I have an adequate sample of inactive, non-US trackables.

-
Predicting Trackable Longevity--A Primitive Actuarial Table
shellbadger replied to shellbadger's topic in Trackables
I get many comments about the money spent on travel bug tags, although I have experimented with bulk numbers on laminated images. I didn't set out to make so many trackables, I simply enjoy making and tracking them and the number just added up. I do not spend money doing destination caching or trying to complete challenges. I rarely go to events. Most of the traveling I do is servicing my own caches, which are my chief means of dispersing trackables. Most of the caches I have logged are found incidental to other activities. I use a lot of COUNTIFs for the summaries, but every record start with a line for each trackable. Drop dates are entered on each line. I organize my trackables by series and the image below is part of the spreadsheet if for one of my smaller and newer series. Obviously there are other cells and spreadsheets where metadata are generated, but this is where everything begins. The release date is not the activation date, but is the date a trackable is either dropped off or changes possession, marking the transition to a new set of risks. Between the drop dates are cells for the calculation of elapsed days and cumulative days after each drop. I average the cumulative times to get the time milestones for each drop. There probably is a way to introduce more automation, but what I have is at the limit of this old man's intellect and, as it is, it has taken me more than 10 years to arrive at this point. After coffee, no small part of every day is dedicated to my records, be it sorting emails, entering drop dates, or streamlining my files. Slower periods are spent assembling or activating trackables, which involves photos and fussing over narratives. I enjoy all of it.
-
Predicting Trackable Longevity--A Primitive Actuarial Table
shellbadger replied to shellbadger's topic in Trackables
It averages about 12% through 15 drops, after that it declines to 6-8%. -
Predicting Trackable Longevity--A Primitive Actuarial Table
shellbadger posted a topic in Trackables
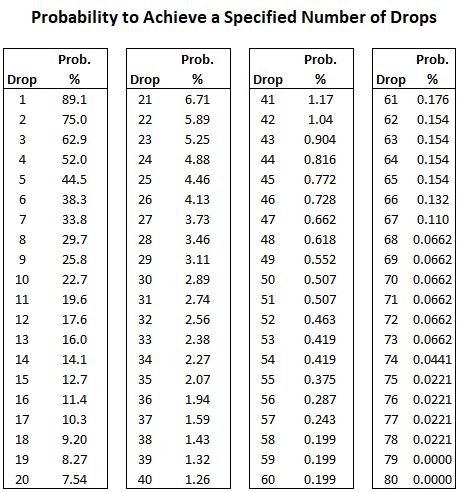
I maintain records on all my trackables. I have linked a number of my spreadsheets so that as trackable activity is recorded, summaries and graphs are automatically updated. One such graph is shown below. It is the survivorship curve of all my trackables, based on the number of drops achieved. The graph shows the activity of 4,593 trackables, released at a rate of about 200-450 trackables per year, between January of 2010, as of 22 Sep 21. The time lag between the latter date and the present is the time required to visit the home page of every one of my trackables to extract information needed for another post to follow, but using data from the same survivorship curve. While the curve is continuously updated, the shape has not materially changed for many years, owing to the number of trackables included, and that at least 75% of the trackables have not had logs for three years (my criterion for missing). As such, the tabulated values shaping the curve might be treated as kind of simple actuarial table, whereby one might predict the chances of a trackable reaching a specific number of drops. For example, the table below predicts that after releasing a trackable, that trackable has an 89.1% chance that someone will retrieve it and make the first drop. Or, there is a 10.9% chance the trackable will go missing before a first drop is made. The chance of making as many as 40 drops is just over one percent, or slightly better than 1 in a hundred. One of my trackables has had 78 drops, producing a probability of 0.0221%. Viewing the table yet another way, 50% of trackables go missing before five drops, which on average is about a year. For now, the reader will have to trust me on that time estimate, but it is close. There are some caveats. These data are based solely on my collection of trackables, nearly 90% of which were released in Texas, mostly on the Southern High Plains in the rural northwest part of the state, south of the Panhandle. The remainder were released in Europe or during travels around the US and Canada. Furthermore, my trackables are widely variable in size, shape and materials. Some are ready-made, some are hand-made. I have no way of knowing if these various circumstances cause significant differences in activity, as compared to trackables released by other cachers. All that said, I doubt any other US-based trackable collection will yield survivorship values that are orders-of-magnitude better or worse than demonstrated here. Trackable activity and longevity outside the US are very different matters, and will be the focus of my next post.
-
I keep records on all my trackables so I really appreciate it when someone notes one is absent. It saves me from annually going through all the logs of those that have not moved in more than a year. I can just mark it missing. If it shows up again, no harm done...I just replace the "missing" entry with the next drop-off date. I ignore discoveries as increasingly meaningless.
-
Expectations for Trackables—An Unscientific Poll
shellbadger replied to shellbadger's topic in Trackables
I guess I was really naive. The first trackable I found had improbably come from California in a little over a year to a pitiful cache in a vacant lot in a residential neighborhood in Lubbock, Texas. I bought in with high hopes and released my first of many travel bugs within a month. I had curiosity, to be sure, but based on my limited experience, I had some expectations too. -
I would like to get a sense of each reader’s expectations when he/she released their first travel bug. Try not to be influenced by any subsequent history. Consider only what would have satisfied you after you made your investment. As they apply, respond in terms of survival time, miles traveled, rate of travel, and/or the number of cachers moving your trackable. Survival Miles Rate Cachers
-
I suspect if I had known about the rate of attrition, I probably would have gone with proxies at the beginning. I also would have bought bulk numbers, if I had thought I was going into trackables the way I have. But then again, where would I have put several thousand originals. I would have to clean up my office to display them.
-
Re the number, I honestly didn't set out to make so many TBs, it just happened. In the beginning I had some health issues that kept me housebound for long periods. Then making them just got to be a habit. I'm a geezer now and there aren't many other options for entertainment, anyway. I have never done proxies, but have been tempted more than a few times. I used to do research for everyone of my travel bugs, but especially for my Art series. I released a bunch of M C Escher drawings only to have someone pick all but one of them over the course of a week. This was early on and I felt like the time I had spent on them was utterly wasted. That happens often enough that I think about proxies again, but while I still hate losing bugs, I haven't spent any time looking into how proxies are made. The one thing I have done to save some money (not considering my time) is purchase bulk numbers and send them out on laminated images. But to continue this long-winded response, I truly enjoy doing the preliminary research, assembling bugs, and following their that the loss of bugs is still just a little short of the threshold where I will throw up my hands and quit. I have thought a lot about the "pretty" idea, it probably should be termed the attractive issue. I honestly have a hard time predicting what will last. I have sent out some large glass beads that are well into what I would call pretty, and predictably they do not last long. I have sent out a lot of other things with military themes...they go pretty fast compared to poker chips and beads, but anything smacking of the Marine Corps usually won't get past 3 or 4 cachers, That said, I have a very large Army 1st Cavalry patch that has been bouncing around in Europe for years. Similarly, I released some state flag patches, and as soon as the Ohio and Kansas flags hit their states, they disappeared. In the end, it is in the eye of the beholder, it is not necessarily beauty. I try to release things that are unusual (no beanie babies or toy John Deere tractors), but not so much so that someone will want it for a trophy...but sometimes I can't help but send out one that even I would like to keep. The only bugs I send out without a hitchhikers are the ready-made trackables. Things like the recent Maker Madness, Witches, Zodiac and Carnival tags. To be honest, I only buy them to eventually compare their survivorship with those of my own making. It is probably pointless, but I put a pop rivet in the holes of those ready-mades just to make it more difficult for someone to put one on their own keychain. We can't do anything about a thief, but maybe we can keep the honest people honest. I see you are from Darwin, Australia. If you were inclined to keep records on your trackables, it would be fun to see how they perform so close to Asia. I just don't get many of mine going to Asia proper, but quite a few will get to Australia. They don't move very quickly because, like the western US, there is a lot of space and few people. Now that truly was long-winded
-
I have finally accepted that the fate of my bugs is completely in the hands of others. All I can do is prepare my trackables as though they must last for years of handling by many cachers. It is a task undertaken with the certain knowledge that half the bugs won’t survive even one year, won't survive handling by as many as six cachers, and that 10-13% will disappear after each release (see here). That said, I also know a handful of my trackables are 10+ years old and others have been moved by 60+ cachers. Thus, except for that first year, when I still believed all my bugs had a future, I have never known how many of them are active at any one time. So, I thought I would try to obtain an estimate at the end of 2020. I defined a trackable in circulation as one having at least one retrieval, visit, or drop log during the calendar year 2020. I reject discovery logs as untrustworthy. I started with the Owned Trackables link on my Dashboard at Geocaching.com, I sorted the list with the Last Log function, the oldest logs at the end. I then pasted part of each line of the list into a spreadsheet. After removing duplicates, the final tally came to 1,421 trackables which is 33.6 percent of all trackables (4,229) released in the years 2010 through 2020. This is a number much greater than I would have guessed, but the total includes the 435 trackables released in 2020. The table below is an accounting of trackables released in years past, but have survived long enough to yield at least one log in 2020. The first column is the year of release, the second column is the total number of bugs released in that year. The row across the bottom shows the sums of the columns above. Read the table as follows. For the year 2010, a total of 240 trackables were released. Of these, 16 had survived to have at least one log in 2020. The 16 value is 6.7% of all the trackables released in 2010, and 0.4% of all trackables released 2010 through 2020. Skipping up to the year 2020, there were 435 releases and 435 logs, including the logs for my releases, mostly into my own containers. The 435 releases in 2020 were 10.3% of all trackables released 2010 through 2020. From the bottom row we learn that the 1421 bugs logged were 33.6% of the 4229 total bugs released before 31-Dec-20. It is hardly surprising that the trend in the percentages of surviving trackables decreases toward the past…with age comes more encounters with cachers and caches, each of which presents new sets of risks. However, there seems to be an attenuation, or leveling off, of the rate of loss in the oldest trackables. If the rate of decline was the same throughout, the line would eventually reach the zero baseline. This attenuation suggests some trackables are persisting better than others, a circumstance that requires me to start a formal investigation of my oldest bugs. I already know why they are persisting, but I have to prove it to the satisfaction of others. This post is an excerpt of a larger project. The full text, including background and more about the methods are here.

-
I have bought codes in lots of 50 in order to make custom trackables. There were some hoops to jump through for the first purchase, made more difficult because I didn't understand the terminology or the process, and because I didn't carefully proof the text to be included on the back of the trackable. For one thing, only Groundspeak can label an item as a Travel Bug. The person I dealt with was very patient with me. In addition, my trackables aren't coins but are unique laminated images, each one of which had to be approved by Groundspeak. Considering only the cost of the numbers, it is a pretty good deal if you intend to make as many 50 trackables. I am a tool/gear junkie so already had a paper cutter, and a color photo printer. I had to purchase laminating pockets and photo paper, but the unit cost is still less than a travel bug tag. Having my own laminating film, FedEx Office let me use their laminator at no cost. However, if I was to assign a value to my time, the unit cost would probably end up being a wash. Making the bugs is fun for me, so I don't consider my time. As others have mentioned, if you have the patience to wait until the first of December, make all your geocaching purchases then. You can get a free holiday promotional trackable for every $25 spent. That is when I buy the TB dog tags I will use during the year, as well as replacement log books and log strips for my caches. As of this moment the sale is ongoing.
-
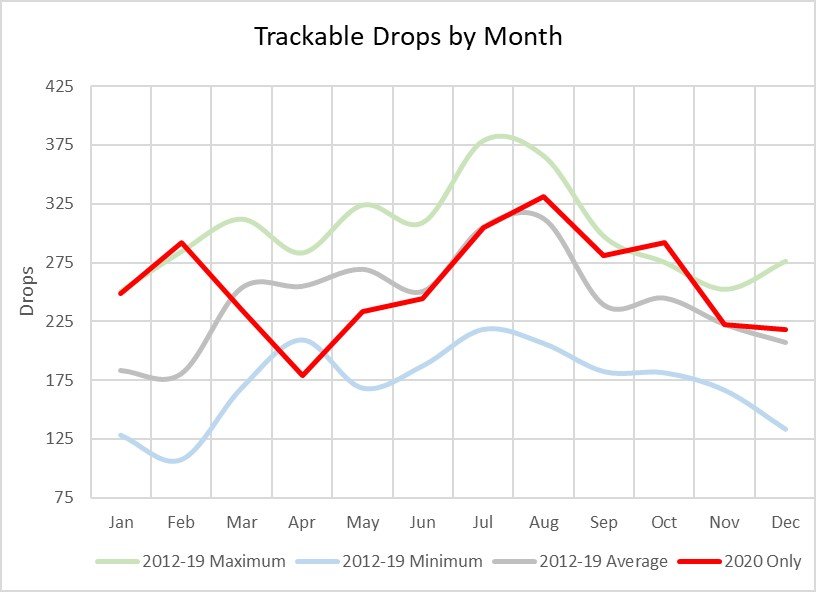
A preamble. I discovered geocaching in 2009, when I was already a long-time-retired old man who was plenty busy. The following year I placed my first hide and released my first travel bug. My focus in geocaching departed the mainstream almost immediately. As the game took me over, documenting the activity of my own caches and trackables appealed to my nature more than tracking down containers hidden by others. I maintain records on all my caches and travel bugs on spreadsheets. However, keeping records for the sake of anything other than seeking insight is pointless. That said, time and numbers are needed to give weight to conclusions. So, I started hiding and maintaining more caches and making more travel bugs…both are now just habits that I can’t break. The point being, after 11 years, I have ample sample sizes over enough time to address virtually any question that occurs to me. I started 2020 not knowing how many trackables I actually have in circulation, given that 50% go missing in the first year after release, while at the same time some small number of my oldest (2010-released) trackables are still active. Thus, in January, I set out to count every trackable that had at least one retrieve/drop/missing log in the 2020 calendar year. Well, as we all know, Covid happened, and beginning in March, I noted releases were declining and reached a record low in Apr. I continued the original count (for another post coming soon), but I retroactively restructured spreadsheets to compare 2020 activity with previous years. The results are graphed below. The three curvy lines in the graph represent the maximum, mean and minimum monthly drops for the years 2012-19. The red line represents the values for the months of 2020 only. While interpreting these data, there are two major considerations. First, because I release 350-500 trackables per year, there a net gain in the number of trackables in circulation each subsequent year. The consequence is that average monthly values annually increase. For example, the January and February values for 2020 are close to what I would have expected for those months. Furthermore, I believed subsequent monthly values would likewise have hovered just above or below the previous monthly maximums. Second, the activity graphed is not just for Texas. The map below (from GCtrackables.com) shows the distribution of caches into which one of my trackables was logged as of the end of 2020…I assume that my travel bugs "in-the-hands-of" are distributed in the same pattern. While it is tempting to state my bugs are world-wide, the influence of trackable activity numbers outside the US, Canada and Europe are minimal. That said, my trackables that have landed northern Europe move far more frequently, and last far longer, than in the US. Thus, they have an effect beyond their smaller actual numbers. To this point I will note that not one of my bugs has been released in Germany, yet at the close of 2020, there were more of my trackables there (82) than in any US state, except Texas. There are no real surprises demonstrated by the graph. Once the threat of Covid was acknowledged by the geocaching public, the March and April 2020 numbers declined. After the various quarantines appeared to have the desired effect, cachers began getting out more, approaching merely average activity patterns in May, June and July. August, September and October values are near what I would have anticipated in a normal year. If there is something a little unexpected, it is the near-average November and December numbers. This is the time when the pandemic reached new levels of concern, so one might have expected numbers at or below that observed in April. However, caching is an outdoor (and for me, solitary) activity and not inherently hazardous. Thus, I believe once the risks from Covid were better understood, cachers worked around them. In my own case, we are two in our own home, we are cautious shoppers, we don’t eat out, our children and grandchildren are remote and we did not travel. Nevertheless, with day-trips, I continued to place new caches, service old caches and drop bugs throughout the year. The only risk I encountered was at the gas pump and I carried a mask, gloves and disinfectant to address that circumstance.

- 1 reply
-
- 1
-
.png)
-
OK, I have the answer, just curious.
-
I assume the coronavirus is responsible for the sudden 60% drop in the volume of emailed trackable logs I receive each day. Those logs originating in Europe are down about 80%. Furthermore, Spring Break traffic should be under way here in Texas, but the stops at my containers are not what they have historically been. Almost certainly cachers are not traveling as much, but I am wondering if there is not also an element of paranoia involved...a reluctance to handle a container or contents, notably trackables, touched by a multitude. Should we buy into this possible concern and disable caches until the nature of the virus is better understood?
-
Things I have learned about trackables--Time-based Survivorship
shellbadger replied to shellbadger's topic in Trackables
You might get an idea from my earlier post on drop intervals. There is some chance they will reappear after a year, but, although it does happen, anything that is inactive for two or more years has a small chance of getting back into circulation. This is based on how my travel bugs were treated. It may be different for another collection, but I doubt it will vary much. -
The earlier posts discussing survivorship were event- or drop-based. That is, what percent of trackables remain after each drop. However, that only tangentially addresses questions centering on how long travel bugs last. For this post, survivorship was determined for each of consecutive six-month periods, out to nine years. I used the same spreadsheet as in earlier calculations, an unsorted portion of which is shown below. The data consists of the first 1,710 trackables released in the calendar years 2010-14. The activity of every trackable was followed through the end of 2019. The E1 and all the C columns are calculations of the total days a drop occurred after the travel bug release...these are the fodder for this post. Now consult the table below. The Yrs column is the six-month intervals under study. The Days column is the six-month interval converted to days. These values were used to determine the number of last-logs occurring on or before that number of days. The n column is the number of last-logs returned by each series of sorts. The Percent Remaining column is the respective n converted to a percent. The Percent Loss column is the percent decline from the previous six-month period. One thing to bear in mind when interpreting these results is that, while the average number of drops per six-month period is between two and three, travel bugs do not move on a regular schedule. Thus, for any given trackable, in any given period, the actual number of drops per six months is observed to be as few as none to as many as five drops. The graph (see below) is the percent remaining plotted against each six-month interval. The overall shape of the time-based curve is not materially different than the drop-based curve. Both show half of the losses occur in the year to year and a half period, or within the first five to six drops. Again, trackable survivorship is much higher in Europe than in the United States. Trackables represented by the left side of the curve were almost exclusively (95%) released in the US and is marked by a precipitous decline. The more-attenuated right side of the curve represents trackables mostly in Europe . Should anyone doubt the European influence on the curve, I have appended the ID numbers of the 35 trackables that survived longer than seven years. Those in red text (11 total) were never dropped outside North America. Although they all lasted for the requisite seven years, many of them have very few drops interspersed with long periods of inactivity. That is a thought I will expand upon in a later post. Those trackables in green text (2) were released in Europe and were never dropped in North America. Those in blue text (22) were released in the US, but at some point found their way off this continent, mostly to Europe. Finally, this is a report on the activity of my travel bugs. I believe, in the main, these data will represent any other US-based collection. However, more access to traveling cachers and regional differences in stewardship can modify the curve to some extent. TB4085Y, TB3M3W7, TB40CX1, TB3ZX3T, TB3ZX48, TB40C6C, TB3EAJ1, TB403K1, TB2T1KW, TB33NPQ, TB33NRJ, TB2REAY, TB2REBJ, TB2REA1, B2T1MC, TB48HJD, TB2T1NF, TB48Q2E, TB48HJV, TB48HKK, TB493Z1, TB40CVX, TB40CX0, TB33QQE, TB48Q1X, TB3ZX3V, TB3MRHQ, TB3EAHP, TB40CWB, TB3ZX38, TB3MRJT, TB4086W, TB3M3WV, TB2T1KN, TB3EAJH.


.png)

.png)


.jpg.9ea9ef3890c19e90850fcbfb34a9414f.jpg)


.png)