

Danie Viljoen
-
Posts
1559 -
Joined
-
Last visited
Everything posted by Danie Viljoen
-
It gets even weirder. I calculated the distribution per day for 4 years, and it turns out that the period is not a year, but 368 days. And the effect is not small - the peaks are about twice as high as days 2 weeks earlier or later. (The graph below has a logarithmic scale; the peak to trough difference is about a factor 8.) So why would a typical cacher be so much more likely to stop after multiples of 368 days than random chance would predict?

-
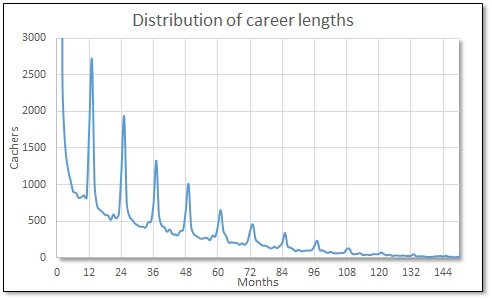
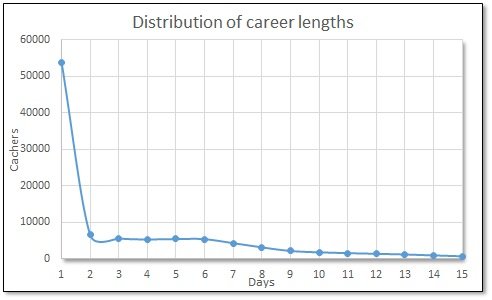
A real mystery I am sure I am missing something obvious in the following one, but I can not think what it is. The first graph shows the distribution of the total career length of all African cachers. Career length is the period between first and last caches logged. What baffles me is why does it peak at yearly intervals? Why would so many cachers stop exactly after full years? The only reason I can think of is that premium members completely stop caching directly after their yearly subscriptions end, but why? (And in any case I suspect few cachers start out on premium.) The second graph zooms in on the first 15 days. 53769 cachers (34.6% of the total) have only cached on a single day. Jors has the longest African career, with 17.9 years (and still going strong). The top 10: 1. Jors 17.9 years 2. Peter Scholtz 17.6 years 3. Brick 17.0 years 4. vklh 17.0 years 5. jawn 17.0 years 6. warthog 17.0 years 7. gräfin 16.8 years 8. Goofster 16.3 years 9. pantomek® 16.3 years 10. GlobalRat 16.2 years (There are only 16 days difference between nos. 3 and 6.)
-
2018 Statistics, part 16: New cachers There were 4744 cachers who logged their first South African cache during 2018. This number is an incredible 60% of the total number of cachers last year! This represents an increase of 6.4% from the previous year.

-
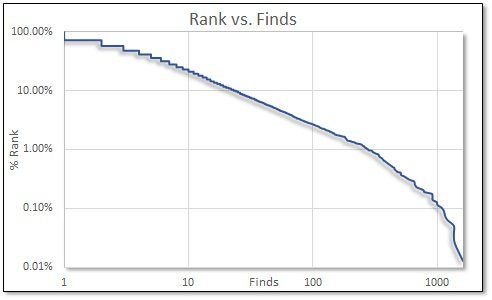
2018 Statistics, part 15: Ranking vs. no. of finds To be in the top 1% of cache finders, you needed at least 278 South African finds for the year (327 the previous year) To be in the top 100 cache finders, you needed at least 226 finds (254 the previous year) To be in the top 10%, you needed at least 24 finds (28 the previous year) To be in the top 1000, you needed at least 18 finds 11 Finds would have placed you in the top 20% of cache finders last year 51.5% of all cachers found 3 or fewer caches last year
-
2018 Statistics, part 14: Cumulative finds distribution: South Africa vs. the rest of Africa I found this one interesting. How to interpret this graph: The horizontal axis is the percentage of cache finders (sorted from most to fewest finds), and the vertical axis is the cumulative percentage of finds. What this means, for example, is that the top 20% of South African finders (red line) have found 83% of all the South African finds for 2018, vs. the 75% of all the rest of Africa finds (blue line) by the top 20% of rest of African finders. The fact that the blue line is below the red line means that proportionally more caches are found by fewer cachers in South Africa than in the rest of Africa. (TechnoNut would have liked this one - it is another example of the 80/20 principle.)

-
2018 Statistics, part 13: RSA finds distribution Of the 7880 cachers who logged at least 1 cache in South Africa during 2018, 2169 only logged a single cache. This is 27.5% of the total. 1534 logged 12 or more caches: 19.5% of the total. The median number of finds is 3 per cacher Because of a small number of very active cache finders, the average is highly skewed: 15.9 finds.

-
2018 Statistics, part 12: South Africa vs. Africa The next graph is another way to look at the information in part 11. It shows the number of cachers in South Africa divided by the number in Africa, for each year. It is clear that the focus (at least cacher number wise) has been shifting away from South Africa

-
Best calendar year ever In 2013 iPajero logged 2415 African caches. That is 6.6 per day, or one every 3.6 hours!
-
2018 Statistics, part 11: Number of cachers: South Africa vs. Africa Whatever the problem in South Africa may be, the rest of Africa does not suffer from it. 33262 cachers logged at least 1 African cache (26026 outside of South Africa) during 2018.

-
2018 Statistics, part 10: Number of cachers 7880 cachers logged at least one South African cache during 2018. Of these, 1535 logged at least 12 (my arbitrary definition of an "active" cacher). The graph of the number of cachers in South Africa took an unexpected turn:

-
2018 Statistics, part 9: Finds The top 10 cache finders in South Africa during 2018: 1. pieterix 1608 finds 2. Team GBS 1380 finds 3. tjoklits 1357 finds 4. iPajero 1355 finds 5. LL_cool_J 1203 finds 6. Strong_Boy 1149 finds 7. The Huskies 1130 finds 8. D_illigaf 1086 finds 9. SKATTIE@1 1002 finds 10. Andredj 990 finds The top 10 for Africa look much the same: 1. pieterix 1608 finds 2. Team GBS 1469 finds 3. tjoklits 1357 finds iPajero 1357 finds 5. LL_cool_J 1203 finds 6. The Huskies 1184 finds 7. Strong_Boy 1149 finds 8. D_illigaf 1086 finds 9. SKATTIE@1 1002 finds 10. Andredj 990 finds
-
2018 Statistics, part 8: FPs per Province Western Cape 1906 FPs 31.7% Gauteng 1420 FPs 23.6% Free State 968 FPs 16.1% KZN 888 FPs 14.8% Eastern Cape 412 FPs 6.9% Mpumalanga 224 FPs 3.7% North West 72 FPs 1.2% Northern Cape 60 FPs 1.0% Limpopo 58 FPs 1.0%

-
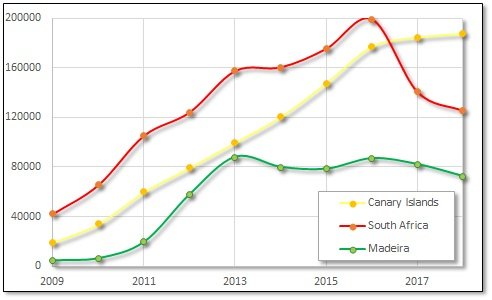
2018 Statistics, part 7: Finds per African country The first graph shows the top 3 (South Africa, Canary Islands and Madeira) on a linear scale. The second graph shows the top 10 on a logarithmic scale. A few remarks: 6 of the top 10 are islands. I suspect this has to do with tourism South Africa is the only country among the top 10 which showed a substantially reduced number of finds. (Even Namibia managed to grow.)

-
2018 Statistics, part 6: More FPs At the end of 2017 there had been exactly 50000 favourite points allocated to South African caches. At the end of 2018 there were 55516 FPs, for a gain of 5516 (11%) During 2018 at least one find was logged on 13533 of the 14613 active caches (i.e., 92.6% of the active caches were found) 5516 FPs distributed among 124937 finds for the year implies that one out of every 22.6 finds was awarded with an FP The 5516 FPs were distributed among 2678 caches (18.3% of the active caches and 19.8% of the found caches) The following graph shows the distribution of FPs (1608 caches got 1 FP, 467 caches got 2, etc.)

-
2018 Statistics, part 5: Favourite Points The following 10 South African caches gained the most FPs during 2018: 1. GC31WXR Table Mountain Travel Bug Hotel City of Cape Town 51 FPs 2. GC6JCHV V&A Waterfront: Bay Vista City of Cape Town 49 FPs 3. GC7TDYF JJJ Giant Cabin (Biggest African Cache) West Rand 44 FPs 4. GC6ZB58 SAS Somerset City of Cape Town 29 FPs 5. GC3WXRQ MEGA SA 2012 -Voortrekker "Uitspan" City of Tshwane 23 FPs 6. GC79361 Prestwich Memorial Tribute and TB Hotel City of Cape Town 22 FPs 7. GC7B84E Cape Town / Table Mountain Virtual Reward City of Cape Town 21 FPs 8. GC1ABZK Table Mountain - Cape Town City of Cape Town 20 FPs GC7X3MJ JJJ Light up the Dam West Rand 20 FPs GC7X4JN JJJ Block Buster West Rand 20 FPs And these South African caches currently have the most FPs: 1. GC31WXR Table Mountain Travel Bug Hotel City of Cape Town 586 FPs 2. GC3WXRQ MEGA SA 2012 -Voortrekker "Uitspan" City of Tshwane 175 FPs 3. GC1ABZK Table Mountain - Cape Town City of Cape Town 153 FPs 4. GC2D9WC SS: Lusitania City of Cape Town 131 FPs 5. GCVDHN Sailors' Star City of Cape Town 117 FPs 6. GC2CG7X Hiddingh Security TB Hotel City of Cape Town 116 FPs 7. GCMYYZ Table Top Trove City of Cape Town 109 FPs 8. GC5Y00Q Tardis City of Cape Town 107 FPs 9. GC1H9WR 2 Oceans Overberg 103 FPs GC5BWV4 UP PERISCOPE City of Cape Town 103 FPs
-
It is indeed lower, but not as much as the total (see part 2 above). The average yearly number of finds for the top 10 caches in 2018 was 16.6% down from the peak in 2015. (I suspect these very popular caches are less affected because they are mostly tourist caches.)

-
2018 Statistics, part 4: Most found RSA caches 1. GC31WXR Table Mountain Travel Bug Hotel Western Cape 235 finds 2. GC7B84E Cape Town / Table Mountain Virtual Reward Western Cape 221 finds 3. GC6JCHV V&A Waterfront: Bay Vista Western Cape 216 finds 4. GCMYYZ Table Top Trove Western Cape 208 finds 5. GC7DAJM 2018 Jolly Jozi Jol Gauteng 177 attended 6. GC7B8X0 Into 7th Heaven Western Cape 173 finds 7. GC62NFH Birth of a gentle giant Western Cape 161 finds 8. GC78HNP Suspension Bridge Eastern Cape 149 finds 9. GC77E Cape Agulhas Western Cape 129 finds 10. GC37VF3 Tip of Africa Western Cape 127 finds GC7FWAZ Vertical Liftoff # 2 Western Cape 127 finds 12. GC19QVQ Three Rondavels Mpumalanga 124 finds 13. GC7TDYF JJJ Giant Cabin (Biggest African Cache) Gauteng 122 finds 14. GC7B71M Cape Light Western Cape 118 finds 15. GC4H10K GOS: Whale Crier Western Cape 114 finds 16. GC707WR Nobel Square 2.5 Western Cape 112 finds 17. GC7CH1J Welcome to Johannesburg, South Africa Gauteng 112 finds 18. GC2JMBA SS: Cape Agulhas light Western Cape 111 finds GC79361 Prestwich Memorial Tribute and TB Hotel Western Cape 111 finds 20. GC6ZB58 SAS Somerset Western Cape 109 finds 21. GCVDHN Sailors' Star Western Cape 106 finds 22. GC3G9Z2 Mother City Meander Series - S.A. Museum Western Cape 105 finds 23. GC4PG5C Bootcamp Gauteng 100 finds 24. GC242A2 Chapman's Lookout v3.4 Western Cape 96 finds 25. GC16GBB Ireland in South Africa Western Cape 92 finds (I see that 2018 Jolly Jozi Jol got 177 logs; does that mean it lost its Mega status?)
-
2018 Statistics, part 3: Finds per day of the year The following graph shows the number of finds for each day of 2018 (red dots). The peak was 2172 finds on 1 October. It is interesting to note that this was not the date of the 2018 Jolly Jozi Jol mega (which was 2 days earlier). There were large numbers of finds on the Black Eagle GeoArt caches on that day; presumably these were logged by mega attendees. 1 October was only the 13th best day ever; the all-time record was 6759 finds on 23 July 2011. The fewest finds last year was 61, on 24 May. The average number of finds per day was 342, and the median was 233. The green line represents the rolling average over a week (to filter out the week-end effect), and the blue line is the same as the green, but averaged over the last 5 years. If you compare the blue line with the green line, you should be able to see when there were above average numbers of finds. The souvenir periods do not seem to have had much of an effect; maybe around the beginning of April. Traditionally the school holidays had by far the largest effect on the number of finds.

-
2018 Statistics, part 2: Finds Another depressing picture - during 2018 124937 caches were found in South Africa, 10.9% fewer than in 2017, and 36.7% fewer than the peak in 2016. This gives an average of 342 South African finds per day (vs. 539 per day in 2016)

-
2018 Statistics, part 1: New caches 1969 new caches were placed in South Africa during 2018, 10.9% fewer than in 2017 (and 34.2% fewer than the peak in 2016). This is an average of 5.4 new caches per day (vs. 8.2 per day in 2016).

-
When were these periods?
-
Carlo Henrico, (scubie999) passed away yesterday.
-
All of these questions have been answered before in this (or the old) statistics thread. I suggest you read through it; you may find other statistics that you can use. Most caches: South Africa (currently 15172 active caches) Fewest caches: Somalia: 0 Highest number of active geocachers: Continental Africa: South Africa. The Canary Islands (administered by Spain) had more cachers logging a cache during the last year, but I suspect the vast majority are European tourists Most ECs: South Africa, by far (There are currently 406 active ECs in South Africa, vs. 509 in the rest of Africa, including the Canary Islands and Madeira) Most Mystery caches: South Africa, by far. (There are currently 1737 active mystery caches in South Africa, vs. 611 in the rest of Africa.) Other website: You can try https://project-gc.com
-
There are two topics on this forum with information about African statistics - Geocaching Statistics and Statistics - bend it anyway you like!
-
New caches per year All new South African caches published, for years ending on 30 June: This year is 32% down from the peak in 2014.


.png)